Relative Frequency - Investigation
Thursday, 23 April 2015 | 0 Comments
Probability is one of those topics where it's best to "see it".
In this activity, students with a 6-sided dice choose the 'winner'. Then, 10 rolls at a time, they tally rolls and then calculate the relative frequency as a fraction and a decimal.
Worksheet:
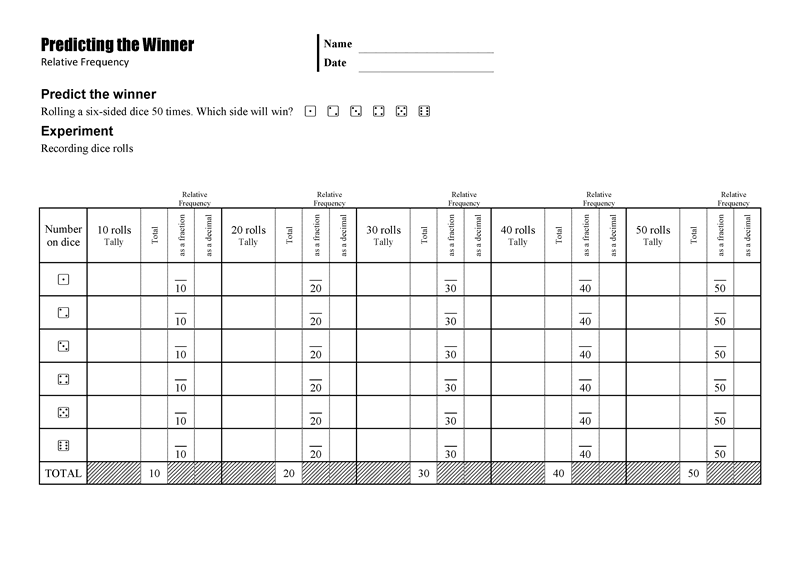
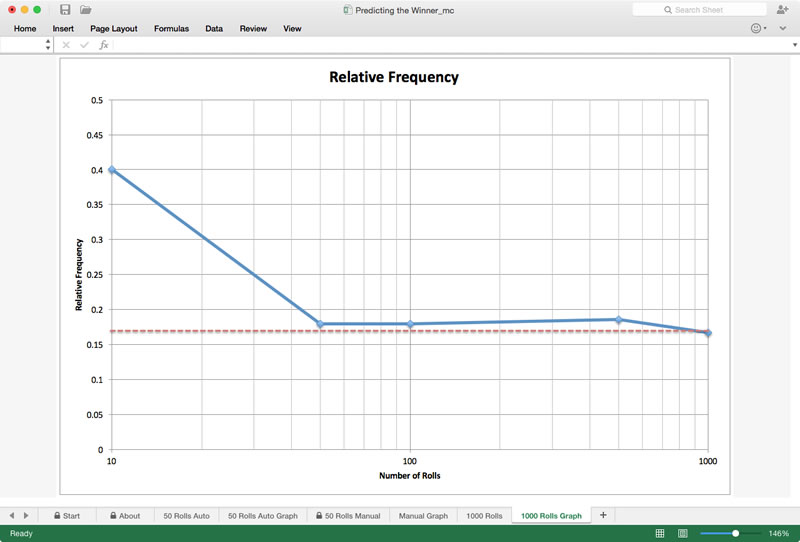
They do this for 50 rolls. On the reverse, students graph results for their chosen dice. The graph includes a line for the theoretical probability.
A nice result would be when the resulting line trends towards the theoretical probability, of course that is not always going to happen - a great discussion point.
In the Excel file, there are three different simulations:
- 50 rolls randomly generated - this could be used to show that there are lot of different ways the results might look, however many of then trend towards the theoretical line.
- 50 rolls , manual entry - this could be used to record one set of results with the class to demonstrate the calculations
- 1000 rolls randomly generated - shows the trend towards the theoretical line, usually
Download the files here:
Posted in • Activity • Lesson Idea • Probability • MathsClass • MathsFaculty • Printable • Worksheet • Software • Excel • Technology • Projector Resource | Short URL: http://mths.co/4077
Post a comment
Commenting is not available in this channel entry.New Subscribe to the …
MathsLinksemail newsletter
Get updates…
About
Simon Job — eleventh year of teaching maths in a public high school in Western Sydney, Australia.
MathsClass is about teaching and learning in a maths classroom. more→
Archive
Elsewhere
 @simonjob
updates via @mathslinks
Recently read/found.
Sydney University abandons HSC prerequisites in diversity push
mathsSeven ways to use diagnostic questions to check for understanding
maths bartonDeveloping a departmental approach to problem-solving
maths bartonDeveloping a departmental approach to reviewing answers
maths bartonDeveloping a departmental approach to worked examples
maths barton workedexamples examples
Comments
There are no comments for this entry yet.