Online picture graphs
Saturday, 12 February 2011 | 2 Comments
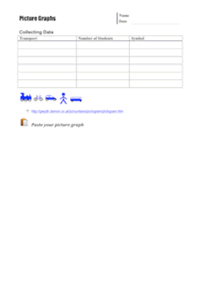
A worksheet to accompany the online tool Pictogram Graph (see on MathsLinks).

Two parts to this activity for a lower ability class:
- Take a class survey on transport methods to school, students record the results on the worksheet (digitally) and assign the symbols. The graph can then be created online, a screenshot taken and their graph pasted into the worksheet.
- Two more sets of data to complete two more picture graphs.
Whilst I thought this task would be straight forward, there was some good discussion with students about changing the scale.
Posted in • Lesson Idea • Graphs | Short URL: http://mths.co/2143
Post a comment
Commenting is not available in this channel entry.New Subscribe to the …
MathsLinksemail newsletter
Get updates…
About
Simon Job — eleventh year of teaching maths in a public high school in Western Sydney, Australia.
MathsClass is about teaching and learning in a maths classroom. more→
Archive
Elsewhere
 @simonjob
updates via  @mathslinks
Recently read/found.
Sydney University abandons HSC prerequisites in diversity push
mathsSeven ways to use diagnostic questions to check for understanding
maths bartonDeveloping a departmental approach to problem-solving
maths bartonDeveloping a departmental approach to reviewing answers
maths bartonDeveloping a departmental approach to worked examples
maths barton workedexamples examples
Comments
author